How to Icrease Online Sales
To increase your online sales, the first step is to diagnose WHY your prospects are not taking the actions that you need them to take…
Luckily for us, modern digital marketing tools make this possible.
Einstein said; “half the solution is in understanding the problem”. This is very true for marketing!
If we can understand why it is falling apart, we have a chance to fix it. Makes sense, right? Here’s how we do that…
Step 1 – Identify Where the Prospect is bailing out
The ‘where’ is the page or spot on your website where prospects are NOT taking the action you need them to take. Instead, they bail out without completing the conversion. Below, I’ll show you exactly how to do this.
You begin by identifying the very last step in your online conversion process (e.g. sales funnel). The sales funnel is the mandatory list of actions you need the prospect to take.
For an eCommerce site, this last confirmation will be the final ‘thank you’ page after a purchase has been made.
For a service business, the last confirmation might be the thank you page the prospect sees after booking their appointment, or it might be picking up the phone and calling you, or filling out a form to request more information.
Whatever that last step is, you need to be very clear in what it is. Once you have identified that last step, use a spreadsheet to document every action the prospect had to take to get there.
Sales funnel example
- Visit Sales page
- Scroll down to bottom (so they can see the add to cart button)
- Click add to cart button
- Enter their shipping details
- Enter their payment details
- Click ‘checkout’ button
- Click ‘confirm’ button
- Arrive at the final thank you page (your order is on the way!)
Your sales funnel will probably look different than this example, but the key is to identify all (but only) the mandatory steps that must be taken by the prospect to be considered a conversion, when they arrive at the final confirmation step.
Together, these steps make up the mandatory journey of the prospect towards the conversion.
We call this list of mandatory steps a ‘funnel definition’, because it clearly defines and makes the process clear and easy to understand for your analytics technician. They are going to need this!
Once you have the funnel definition, your technician can use Google Analytics and other tools to identify at which step in their mandatory journey the prospects are bailing out. This is the ‘where’. Take a look at the graphic below with the green arrows. This is actual data from a real sales funnel. That data and graph were generated in Google Analytics, using a feature called Funnel Visualization.
Once you know the ‘where’, you can then try to figure out the ‘why’. Without the where, you’ll never get to why, which is why we must begin with an accurate funnel definition and a funnel visualization.
The data revealed in the funnel visualization is the foundation of conversion rate optimization (CRO). Without it, you’ll be like a blind man stumbling around in the dark, groping hopelessly for a light switch. You can only guess at what the problem might be.
With this data, you have a real chance of success. It still is only a chance. Not all conversion problems can be solved. But without the where and the why, conversions problems most certainly can never be solved.
Got it? Let’s move on…
Make sure these tracking tools are working correctly on your site
Here are three essential three tracking tools you’ll need:
- Google Tag Manager. Install GTM, then configure it to track the steps in your sales funnel. You’ll need to integrate this with Google Analytics.
- Google Analytics. Before you begin, be sure to create two additional ‘Views’. You’ll need a CLEAN view to filter out your own visits to the website. You’ll also need a TEST view so you can test your configurations before unleashing them on your CLEAN view. Once you have all that setup, under the Conversions section, setup a Funnel Visualization (see sample below). A visualization of your sales funnel will track each step a prospect must take in their journey to a successful outcome. It is helpful to document this journey in a spreadsheet first, then use that spreadsheet as the map to configure GTM and GA.
- User Engagement Recording. There are several choices on the market to choose from. We have a special agency account at Hotjar, and Smartlook, but you can pick any tool you like which records video of the users’s screens, as they navigate your site. These recordings will give you the ability to watch over their shoulder and see what they click on and how long they linger on various components of your page. These recordings will help you discover the ‘why’.
- Use Google Optimize, which is a free tool offered by Google to conduct website experiments. Ever wonder if you should make changes to the color or the text or an image? Google Optimize will tell you if your ideas actually make a difference.
- You can also use a call tracking service, such as CallRail, to identify which of your ads are working best, and which versions of your website convert the best.
Step 2 – Identify where the online sales funnel is breaking down
The above tracking tools will supply you with information that can help identify the problem. Here are two methods for reviewing your data:
- Review screen recordings. By watching videos of your visitor’s journey through your site, you can often spot interface problems.
- Review drop-offs in your funnel visualization. Once Google Analytics has collected enough data, you’ll begin to see a pattern emerge.
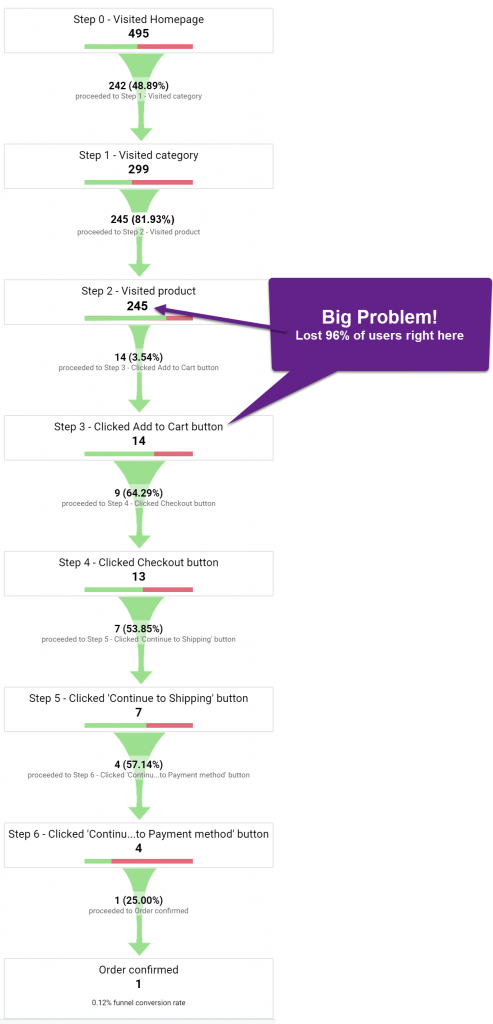
As you can see in the above example, the majority of site visitors are bailing out after they view your product. If you could just get a small number of additional people clicking the Add to Cart button, your entire sales will improve with big impact on your revenue. Of the 231 lost visitors, if you could just get 14 additional people clicking the button, your sales would theoretically double. Your next step is to examine your product page and start coming up with hypothesis as to why them might be dropping off. The reasons will usually fall into one of these categories:
- Price point is too high (or too low)
- Images are not appealing
- Descriptions are not appealing
- Too much perceived risk
- Genuinely not interested in the product. Could not see the relevance to their lives.
How do you know what the real issue is? This is where screen recordings can be very revealing. What components of the page did they dwell on or click? How much time did they spend? Did their behavior resemble someone who has true interest in the product?
Step 3 – Create the fix and test
Once you understand the problem better, and have a hypothesis on how to fix it, you’ll then need to test it. Unless the problem is obvious, (such a broken link), you should conduct AB testing to prove or disprove your hypothesis. Never trust your assumptions. Always AB test to prove them.
Summary
Not all conversion problems can be solved, but they are impossible to solve without first identifying where the problem is in the first place. Once you think you have identified the problem(s), you must test to confirm.